Launch and Tour MPLAB® X IDE
After installation, you'll find a new MPLAB X IDE icon ![]() on your desktop. Click on this to get started.
on your desktop. Click on this to get started.
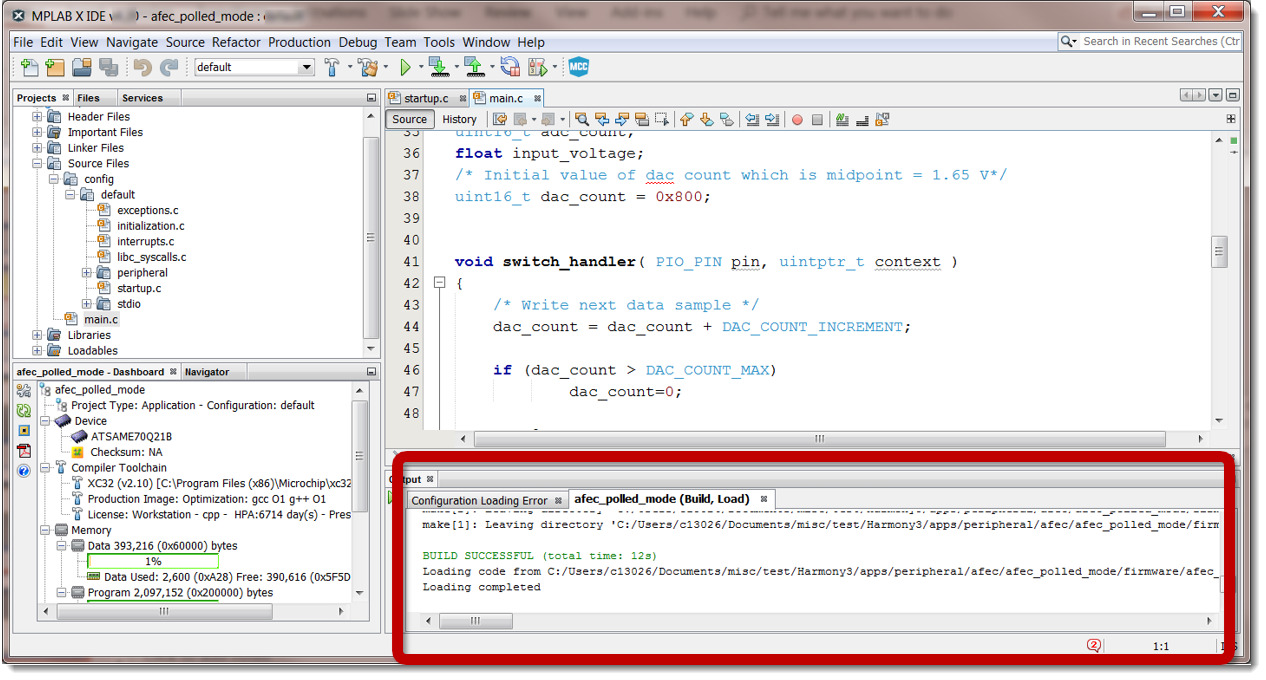
When a project is opened (click File > Open Project…), the MPLAB® X IDE user interface will fill with four windows. These windows are moveable and can be resized to meet your needs. You can even undock these windows for use with multiple monitors. There are several toolbars distributed among the windows.
Project Toolbar
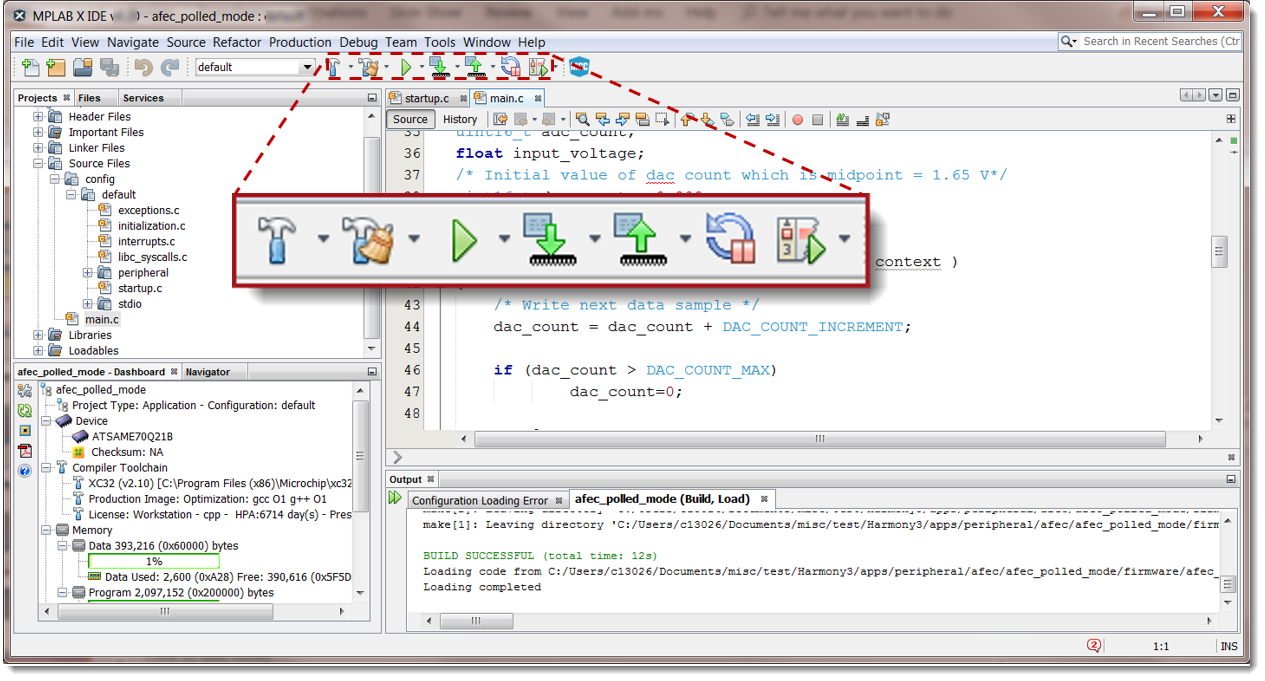
At the top center of the main user interface are the tools enabling you to manipulate the project. The icons allow the project to build, the code to be programmed into the MCU, or a debug session to start.
Projects Window
The upper left-hand corner is the Projects window. When the 'Project' tab is selected, you will see a virtual representation of all the resources used as inputs to the project. These resources include source code, header files, and libraries. If one of the sources of header files is double-clicked, the file will open up in the Editor window.
Editor Window and Toolbar
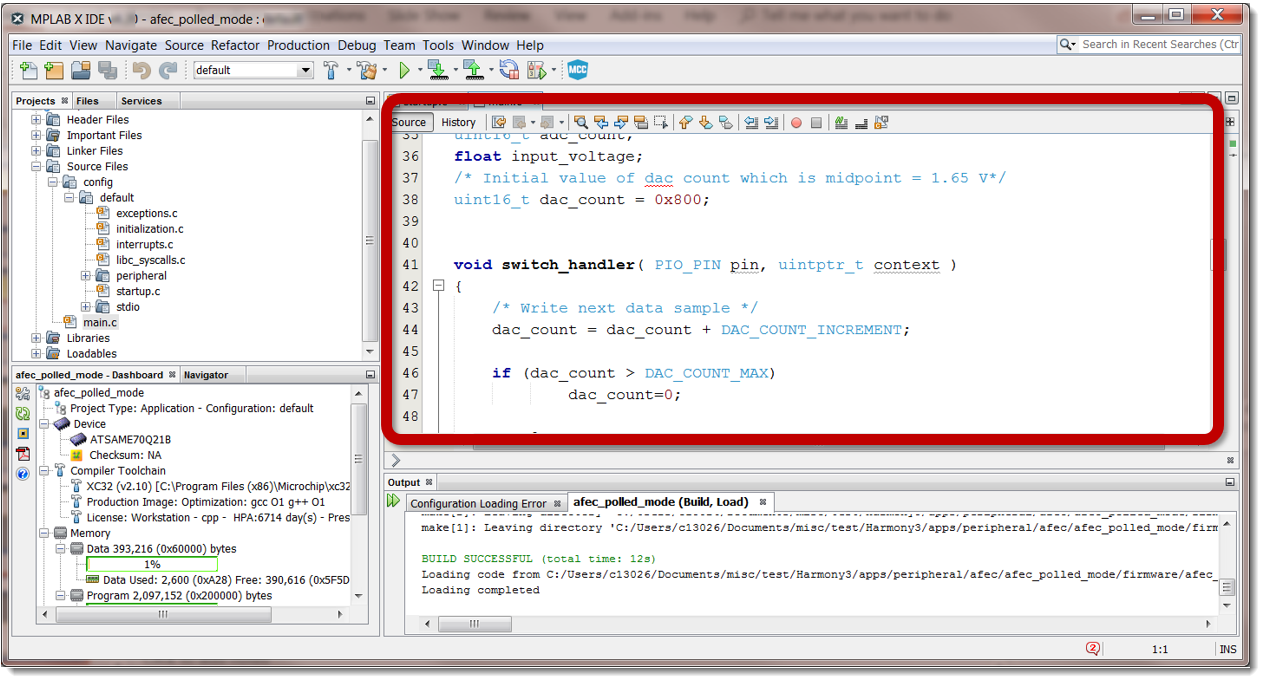
The Editor window is located in the upper right portion of the user interface. This window has a tab for every source or header file which has been opened. You can edit any open file.
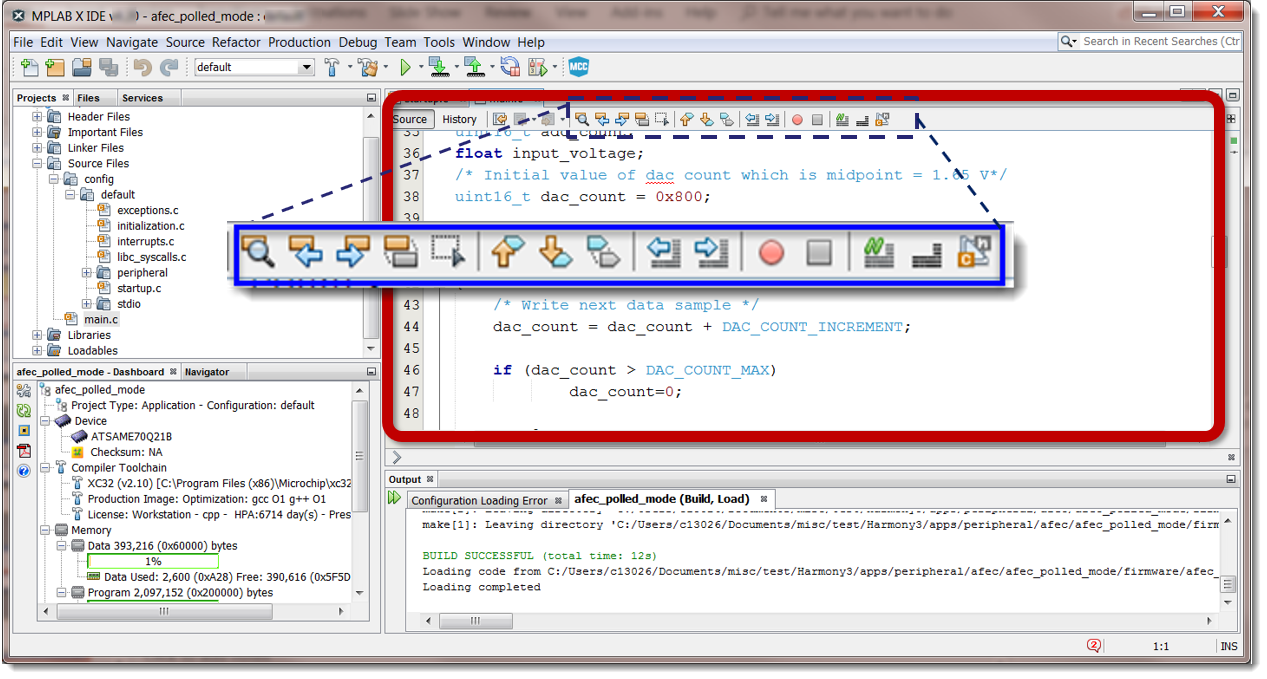
At the top of the Editor window is a toolbar containing editor function shortcuts.
Dashboard Window
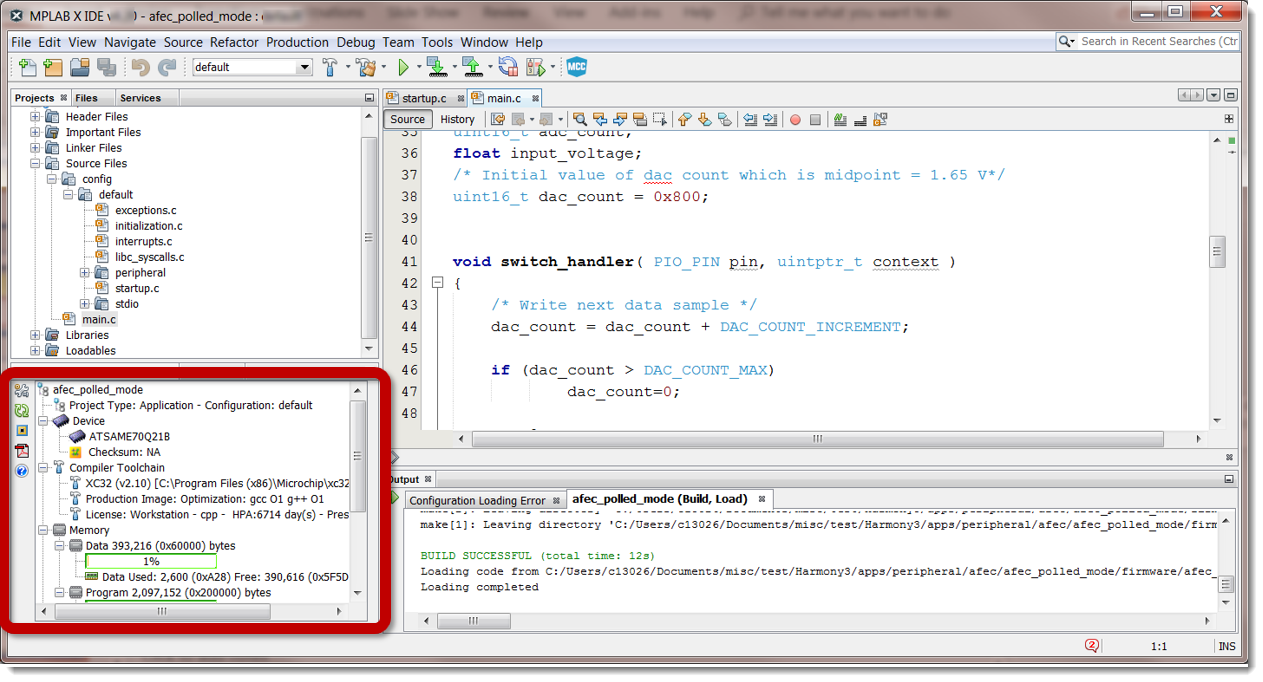
The lower left-hand corner contains the 'Dashboard' and 'Navigator' tabs. The Dashboard displays the status of the project, including build size, checksum, and tools used to build and debug the project.
Output Window
The Output window is used by MPLAB X IDE to send information to the developer. It displays the results of a project build. This window shows the value of the application variables and MCU registers during debug sessions.

